
Behind the Grades: A Data-Driven Look at Student Mental Health
- Jul 16
- 4 min read
INTRODUCTION
Across college campuses many things differ but few remain the same. The average college student’s struggle to juggle exams, assignments, part-time jobs, societal expectations and the list keeps going on forever. One very important aspect of our lives gets left behind in this struggle, mental health. This paper uses real surveyed data from 101 university students in an attempt to explore the rates of mental health issues and how they relate to factors such as CGPA, major, marital status, and year of study. The goal is to find a correlation between different factors and their effects on student mental health.
ABOUT THE DATA
The dataset set contains information on 101 students. They were asked whether or not they suffered from depression, anxiety, and/or panic attacks, whether or not they reached out for help, marital status, CGPA, major, year of study, and gender.
Before analysis, the data was thoroughly checked for errors and inconsistencies. A student’s age was missing, since only one value was missing; the median age of 19 was filled in instead.
FINDINGS
How common are these conditions?
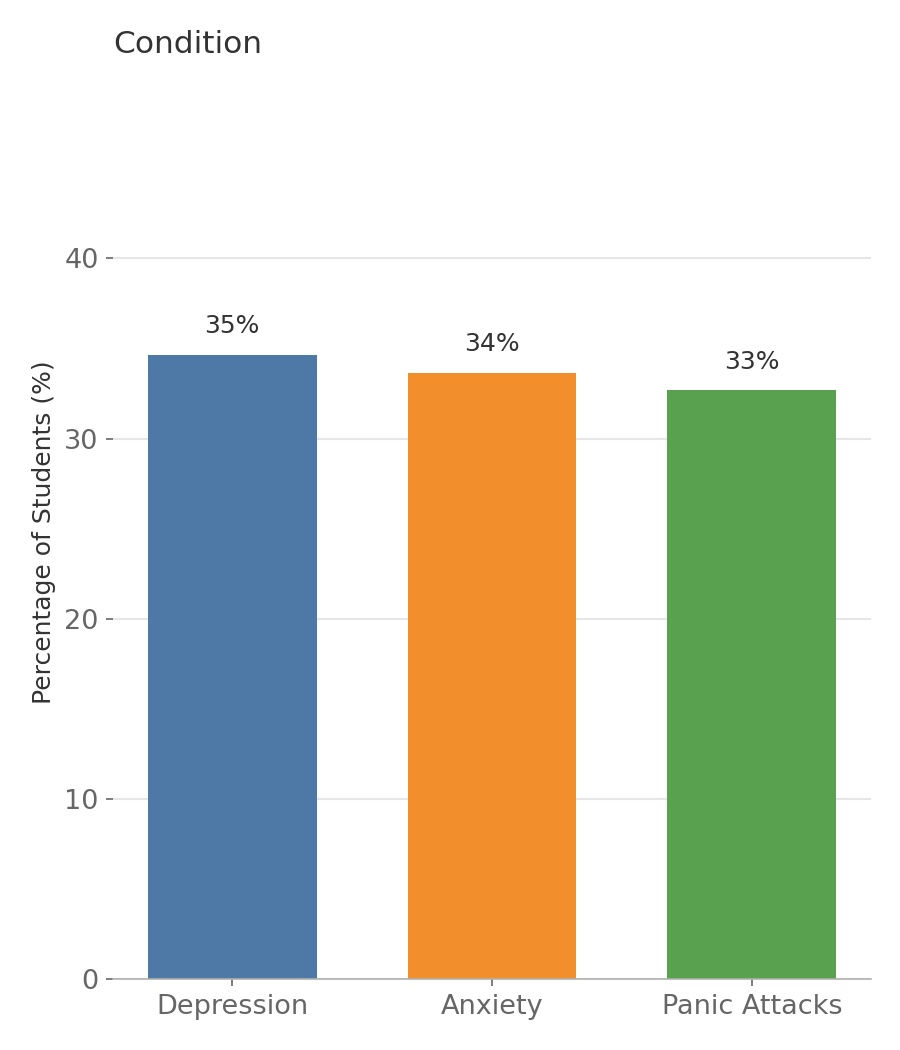
The first question I wished to answer was how common depression, anxiety, and panic attacks are in this group of students. As Graph 1.1 shows, roughly one in three students reported suffering from one of the conditions. 35% said they suffered from depression, 34% said they experience anxiety, and 33% reported suffering from panic attacks. These statistics tell us that mental health struggles are not simply exceptions – they affect a substantial share of the student population, an important starting point for this study.
Does year of study matter?
Graph 1.2 breaks down whether or not students report suffering from any one of the three conditions part of the survey. The number of students reporting mental health struggles is the highest in Year 1 students, with over half suffering. The proportion of those with struggles greatly shifts towards those suffering, a huge gap between both categories can be noticed. But, the case for Year 4 is surprisingly different. Most report not having any issues, this may be because students get better at managing time over the years. It must be noted that only 8 participants of the survey are students in the 4th year of college, so these results do not present a conclusion but an occurrence which needs to be investigated further.

How does College Course and CGPA affect?
Graph 1.3 shows the number of students reporting at least one condition, split by CGPA and College Course. By course, BIT reports the highest rate at 90%, followed by KOE at 83%, versus 57–61% for BCS, Engineering, and other courses combined — though BIT and KOE are small groups (10 and 6 students) and this should be treated as a lead, not a settled fact. By CGPA, there is no clear trend: the two largest bands, 3.00 - 3.49 and 3.50 - 4.00, both sit near 65%, while the lowest rate (25%) comes from a tiny 4-student group. CGPA does not appear strongly linked to mental health struggles here, while course of study shows more separation worth confirming with a larger sample.

Are students getting help?
Graph 1.4 looks at whether or not students reporting mental health struggles seek professional help. Amongst the 64 students that had at least one of the three conditions, only 9% sought out help. This is an astonishing result, even though an overwhelming majority of students are suffering from conditions very few end up receiving professional treatment. This can mean two things: either that there is a stigma related to mental health still greatly present across the world, or that there is a lack of facilities for students to receive help.

Do these conditions overlap?
Another important question is how many students are managing multiple conditions simultaneously?
Out of the 101 students surveyed, 18 report suffering from two conditions and 10 report suffering from all three conditions. That totals up to 28, a quarter of the study. This matters because these students would likely require much more comprehensive support than someone suffering from only one condition, yet the data on treatment-seeking suggests that very few students receive that support.
DISCUSSIONS AND LIMITATIONS
Taken together, these findings present to us huge issues. Mental health struggles have become a part of the norm in college life. Almost every student part of the survey has reported at least one issue, a few reporting suffering from multiple conditions at once. The most concerning part? The fact that very few students go ahead and seek professional support. The causes for this could be many, the fact that it is normalised, the lack of sufficient facilities to discuss these issues, stigma regarding these topics etc.
We must take into account the limitations of this data set. Certain groups (like Year 4 students) are represented by a very small number of individuals, so their results can vary drastically due to one single response. The data is also self-reported, this means that students may have self-diagnosed themselves with certain conditions based on their own perceptions rather than a medical diagnosis. There may also be cases of students submitting untruthful data. Finally, this is a correlational study. It shows how certain things can occur together, but not that one causes the other.
CONCLUSION:
This analysis of 101 university students shows that mental health challenges such as depression, anxiety, and panic attacks are common, affecting roughly a third of the sample, and that treatment-seeking remains low even among affected students. Differences by course, year of study, and marital status point to specific groups that may benefit from targeted support, while CGPA appears largely unrelated to these struggles; these patterns should be confirmed with larger studies. Overall, the exercise demonstrates how even a small, well-cleaned dataset can be turned into clear, honest visual evidence using simple data science tools like Python in Google Colab or dashboards in Tableau.


