
What factors affect the CPI value for food?

The increase in the price of food, which is known as inflation, has been a constant issue. With it affecting the spending patterns and disposable income of consumers along with influencing economic policy. Especially due to the price of food being more sensitive to supply shocks due to inelastic demand and a longer period to produce it. This report will use the monthly change in the consumer price index for the fiscal years 2019 to 2024 to look for differences in the rate of change and compare them to events that occurred around that time to find a cause. This will help answer the research question, which is ‘What events affect the change in the CPI value? ’
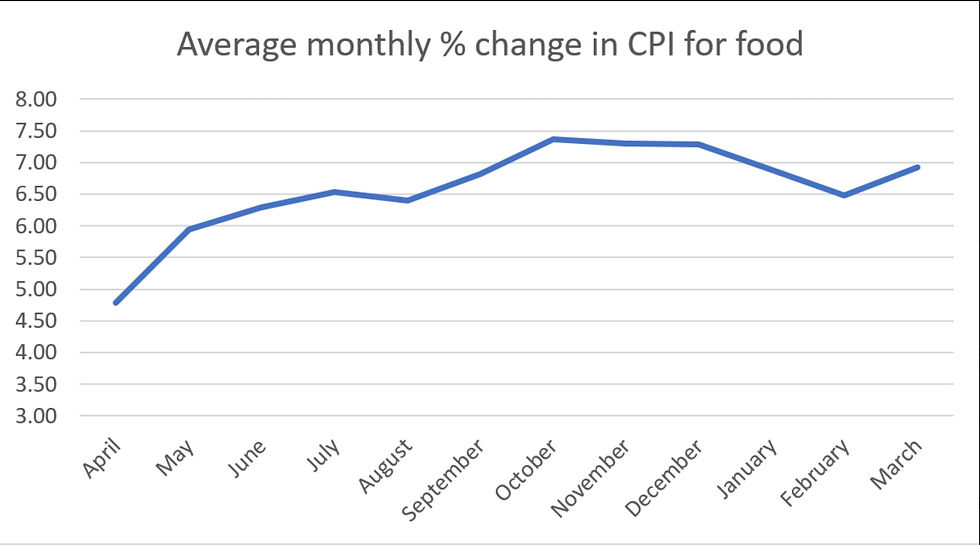
Below is a graph showing the average percentage change in the consumer price index (CPI) per month. This should help us find anomalies when the CPI growth rate changes. The graph shows an increase in the rate of inflation of goods from October to December which can be due to festivals increasing demand and causing prices to increase.
In Figure 1.2, there was an increase in the CPI between November and February, where the CPI went from 2.99% in August to 14.19% in December. This can be due to heavy rains that occurred in Maharashtra and Karnataka that damaged Kharif crop like onions and increasing their selling price.

Fig 1.2: Change of CPI value over fiscal year 2019
Weather events also affected the rate of inflation in the financial year 2023, with the rate of inflation rising to 11.51 in July, as seen in fig 1.3. This can be due to the quantity of rain received being much lower than before, leading to the harvest of tomatoes, potatoes and rice reducing and causing the supply in the market to decrease like in November 2019 when heavy rains occurred.

Fig 1.3: Change of CPI value over fiscal year 2023
The rate of inflation in May 2021 rose to 5.01% from 1.96% in April, this can be due to the second wave of covid which led to supply shocks as the production and transportation of food was restricted due to the lockdown.

Fig 1.4: Change of CPI value over fiscal year 2021
When the second wave of COVID’s lockdown ended in December, The CPI value rose from 1.87% in November to 4.05%, seen in fig 1.4. This is due to demand increasing quickly due to consumers having excess capital as consumption was reduced in the previous months while supply recovered at a slower rate as producers had to increase consumption of resources and produce the products.
Effect of war on inflation
The war between Russia and Ukraine, which started in February 2022, led to imports from the 2 countries reducing dramatically due to constant attacks on port facilities and ships. Causing shipments of sunflower oil from Ukraine and oil from Russia reducing, leading to the price and cost of producing food increasing. Along with wheat increasing in price and producers in India being incentivised to export wheat, reducing the supply in India. This is seen in Fig 1.4 where the CPI increased further from 5.85% to 7.68% in march 2022 and continuing to be high in the next fiscal year and slowly reducing with July having a CPI value of 6.69%. due to producers finding substitute resources to use causing inflation to rise at a slower rate. Seen in figure 1.5.

Fig 1.5: Change of CPI value over fiscal year 2022
The data shows that the value of CPI for food items is volatile, with factors like war or weather events disrupting supply chains and creating supply shocks. Which causes supply to decrease and not being equal to demand. While the festive season and period after a lockdown leading to demand increasing faster than supply and leading to market disequilibrium and inflation.


